OpenObserve: The Ultimate Open-Source Platform for Log and Metric Insights
Table of Content
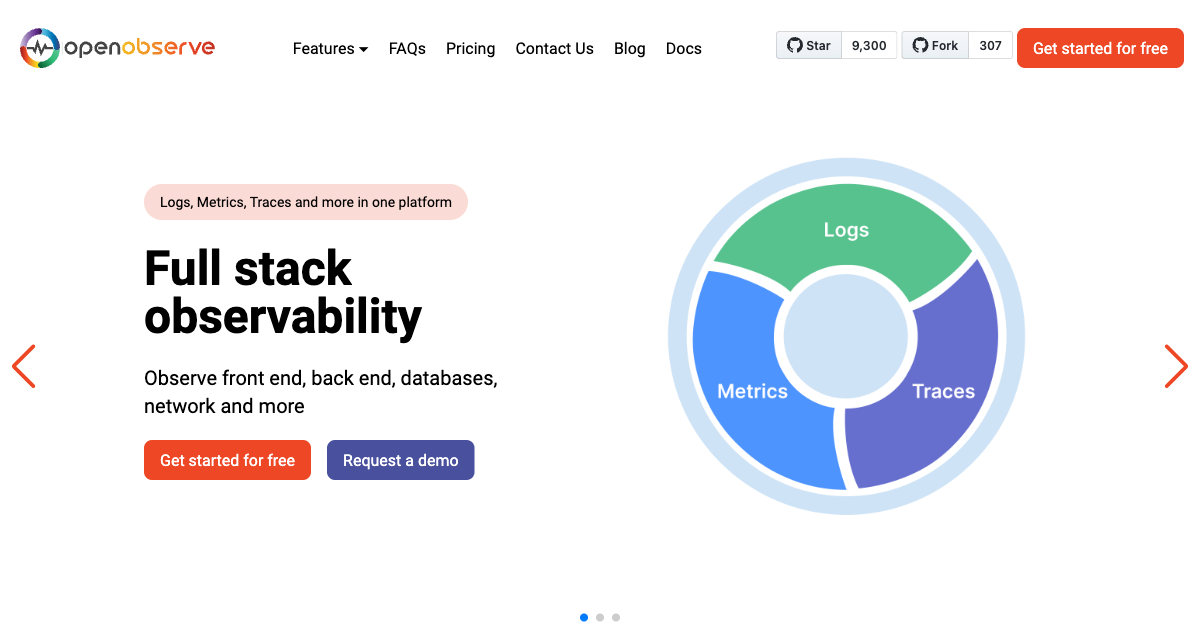
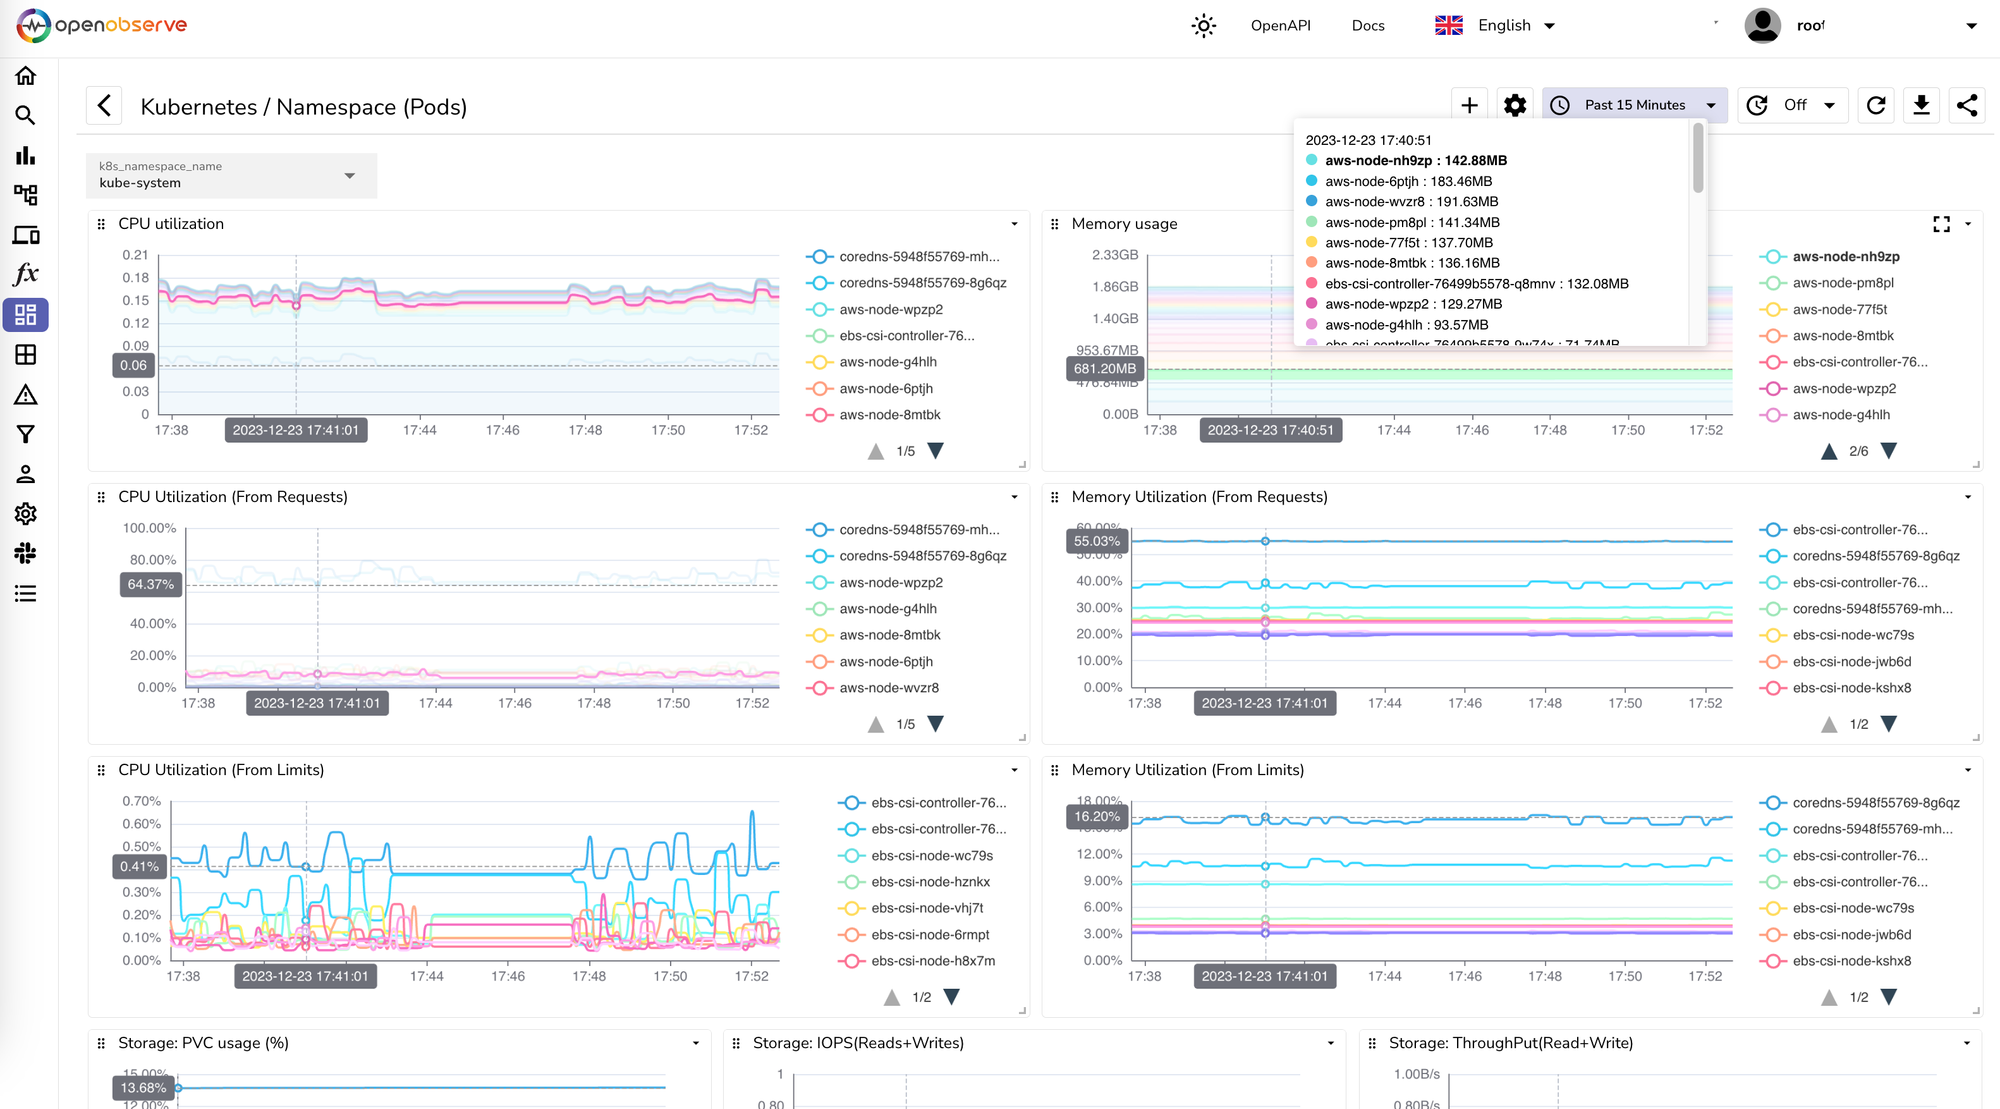
OpenObserve is a cloud-native observability platform designed for logs, metrics, traces, analytics, and Real User Monitoring.
It is easy to operate, can be set up in under 2 minutes, and serves as a seamless replacement for Elasticsearch. It comes with its own user interface and can reduce log storage costs by approximately 140 times compared to Elasticsearch.
OpenObserve is an observability platform offering log search, infrastructure monitoring, and APM solutions. It significantly reduces storage costs and requires lower resource utilization, resulting in lower overall costs.
Features
- Logs, Metrics, Traces: Comprehensive support for various data types.
- OpenTelemetry Support: Full compatibility with OTLP for logs, metrics, and traces.
- Real User Monitoring (RUM): Includes performance tracking, error logging, and session replay.
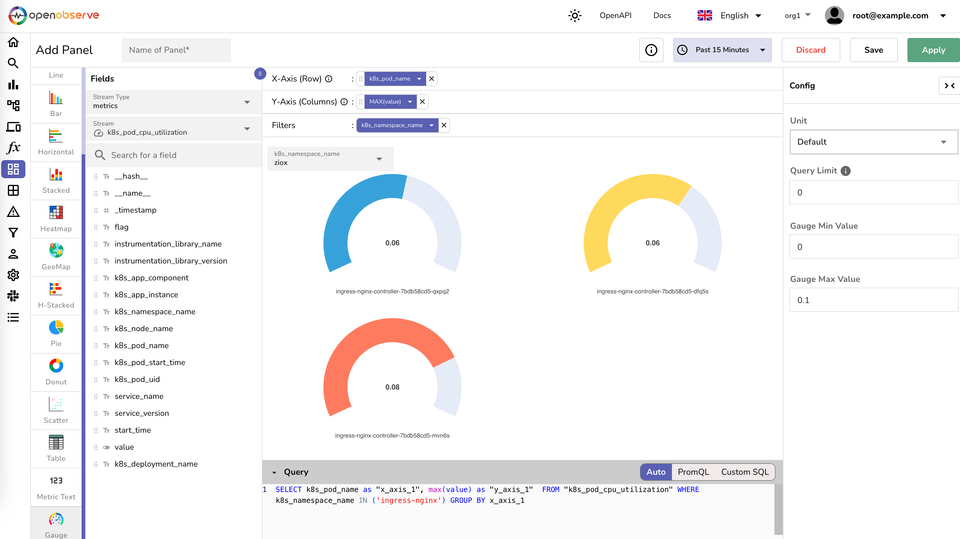
- Alerts & Dashboards: Features over 14 different chart types for comprehensive data visualization.
- Advanced Ingest and Query Functions: Aid in enrichment, redaction, log reduction, and compliance, like redacting sensitive data from logs.
- Advanced Embedded GUI: Intuitive and user-friendly interface.
- SQL and PromQL Support: Query logs and traces with SQL, and metrics with SQL and PromQL.
- Single Binary Installation: Easy installation and running, with binaries available for multiple platforms under releases.
- Versatile Storage Options: Supports local disk, S3, MinIO, GCS, Azure Blob Storage.
- High Availability and Clustering: Ensures reliable and scalable performance.
- Dynamic Schema: Adapts to your data structure seamlessly.
- Built-in Authentication: Secure and ready to use.
- Ease of Operation: Designed for simplicity and efficiency.
- Seamless Upgrades: Hassle-free updates.
- Multilingual UI: Supports 11 languages, including English, Spanish, German, French, Chinese, and more.
- Easy to install using Docker.
Install Using Docker
docker run -d \
      --name openobserve \
      -v $PWD/data:/data \
      -p 5080:5080 \
      -e ZO_ROOT_USER_EMAIL="[email protected]" \
      -e ZO_ROOT_USER_PASSWORD="Complexpass#123" \
      public.ecr.aws/zinclabs/openobserve:latest
Install using Docker Compose
services:
  openobserve:
    image: public.ecr.aws/zinclabs/openobserve:latest
    restart: unless-stopped
    environment:
      ZO_ROOT_USER_EMAIL: "[email protected]"
      ZO_ROOT_USER_PASSWORD: "Complexpass#123"
    ports:
      - "5080:5080"
    volumes:
      - data:/data
volumes:
  data:
License
OpenObserve is licensed under the AGPL-3.0 license. For more details, see the LICENSE.
Resources & Downloads
