Lightdash: Is an Open-source Business Intelligence (BI) Dashboard
Lightdash instantly turns your dbt project into a full-stack BI platform. Analysts write metrics and Lightdash enables self-serve for the entire business.
Table of Content
Lightdash is an open-source business intelligence (BI) dashboard that enables users to easily visualize and analyze their data. It is designed to help businesses of all sizes make data-driven decisions by providing a simple and intuitive interface for exploring data.
Features
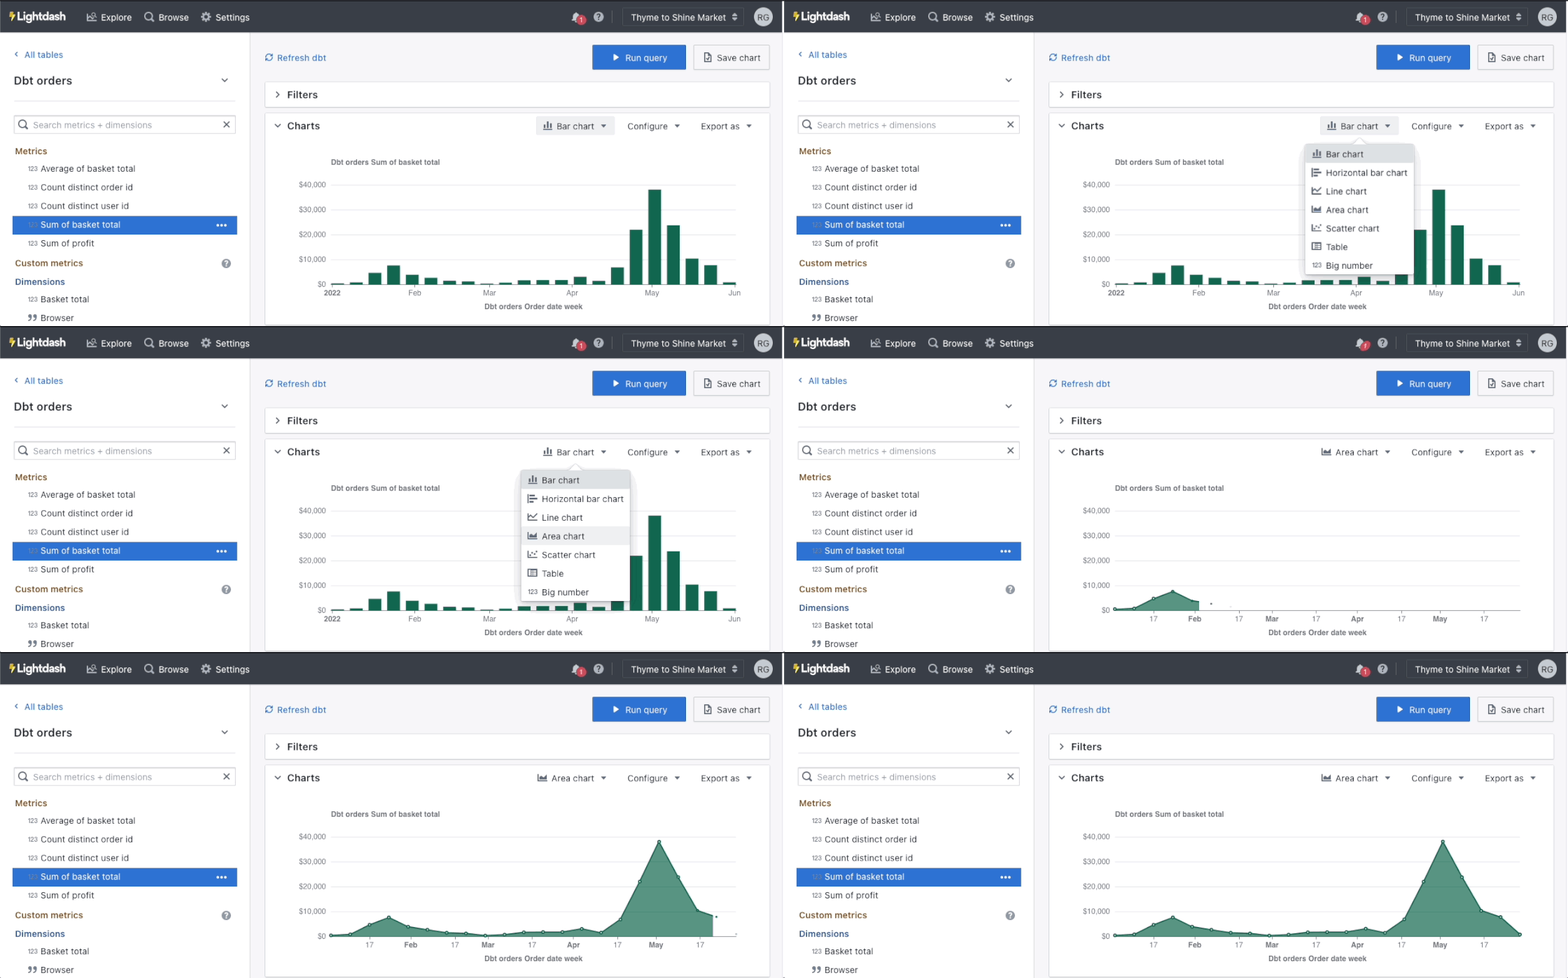
Lightdash offers a range of powerful features that allow users to:
- Connect to multiple data sources, including databases, spreadsheets, and cloud-based services.
- Build custom dashboards with interactive charts, tables, and other visualizations.
- Filter and drill down into data to uncover insights and trends.
- Export data to CSV, Excel, or JSON format for easy sharing and collaboration.
- Share data and dashboards with team members or external stakeholders.
- Customize the look and feel of dashboards to match your brand or style.
- Familiar interface for your users to self-serve using pre-defined metrics
- Declare dimensions and metrics in yaml alongside your dbt project
- Automatically creates dimensions from your dbt models
- All dbt descriptions synced for your users
- Table calculations make it easy to dig into your data, on the fly
- ️Lineage lets you see the upstream and downstream dependencies of a model
- Simple data visualisations for your metrics
- Save charts & build dashboards to share your insights with your team
- Share your work as a URL or export results to use in any other tool
Interface
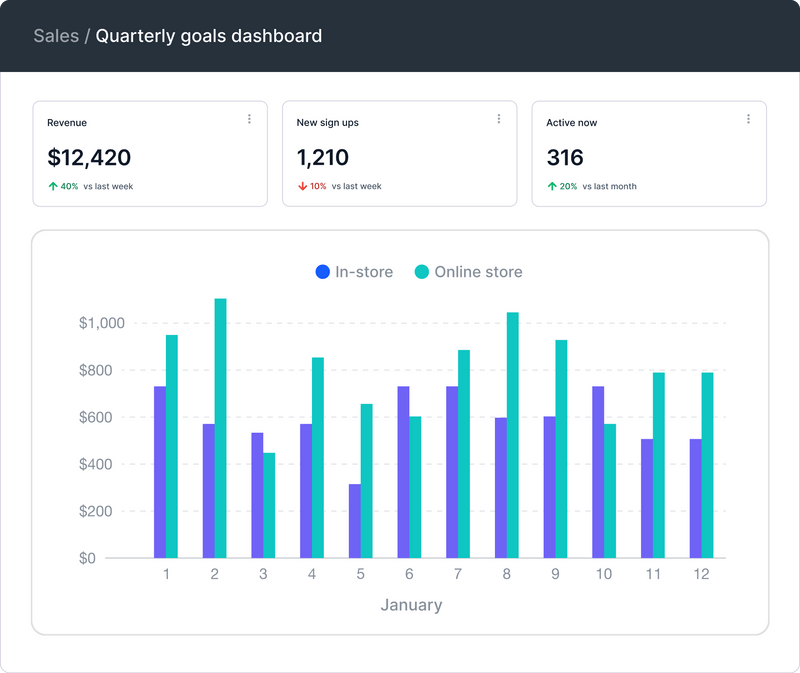
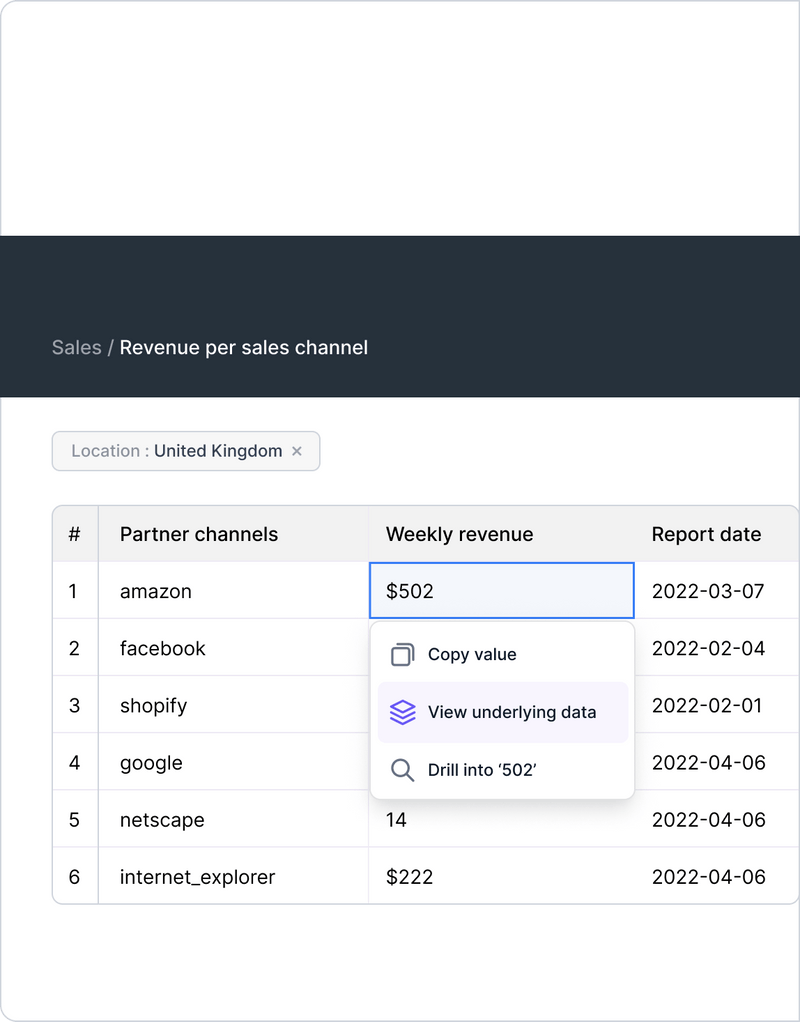
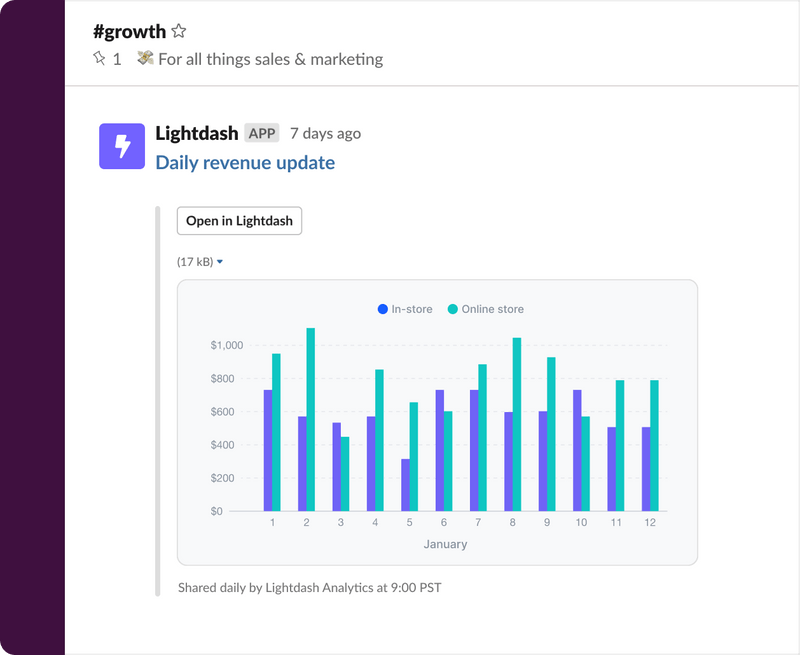
The Lightdash interface is designed to be user-friendly and intuitive, with drag-and-drop functionality for creating and editing dashboards. The dashboard editor allows users to add and arrange charts and tables, add filters and slicers, and customize colors and fonts.
Data Export
In addition to its powerful visualization capabilities, Lightdash also makes it easy to export data in a variety of formats. Users can export data to CSV, Excel, or JSON format, making it easy to share data with team members or external stakeholders.
Share Data
Lightdash allows users to share data and dashboards with team members or external stakeholders. Users can set up role-based access controls to ensure that only authorized users can view or edit data.
Community
Lightdash has an active and growing community of users and contributors who are constantly improving the software and adding new features. The community offers support and guidance to users through forums, documentation, and other resources.
Analytics
Lightdash offers powerful analytics capabilities, including the ability to perform advanced calculations and create custom metrics. Users can also create custom data pipelines to transform and clean data before it is visualized.
Data sources
The project supports several data sources that include: Databases such as PostgreSQL, MySQL, GitHub, GitLab, Slack, Databricks, Redshift, dbt, Azure DevOps, and Firebolt
Requirements
Lightdash is built on open-source technologies and can be run on a variety of platforms. The minimum requirements for running Lightdash are:
- A modern web browser (Chrome, Firefox, Safari, or Edge)
- A server running Linux or macOS
- Docker and Docker Compose
Setup
Setting up Lightdash is easy and straightforward. Users can download the latest release from the Lightdash website and follow the installation instructions. Once installed, users can connect to their data sources, customize their dashboards, and start exploring their data.
License
Lightdash is released under the Apache 2.0 license, which means it is free to use and modify. Users are free to distribute their modified versions of the software as long as they comply with the terms of the license.
Conclusion
Lightdash is an open-source business intelligence dashboard that allows users to connect to multiple data sources, build custom dashboards with interactive charts and tables, filter and drill down into data, export data to various formats, and share data and dashboards with team members or external stakeholders.
It offers a user-friendly interface with drag-and-drop functionality, powerful analytics capabilities, and can be run on a variety of platforms. Lightdash is released under the Apache 2.0 license and has an active community of users and contributors.
Resources


