Ipyvolume - The Best 3D plotting Directly within Jupyter Notebook for Data Scientists

Are You Truly Ready to Put Your Mobile or Web App to the Test?
Don`t just assume your app works—ensure it`s flawless, secure, and user-friendly with expert testing. 🚀
Why Third-Party Testing is Essential for Your Application and Website?We are ready to test, evaluate and report your app, ERP system, or customer/ patients workflow
With a detailed report about all findings
Contact us nowTable of Content
What is Ipyvolume?
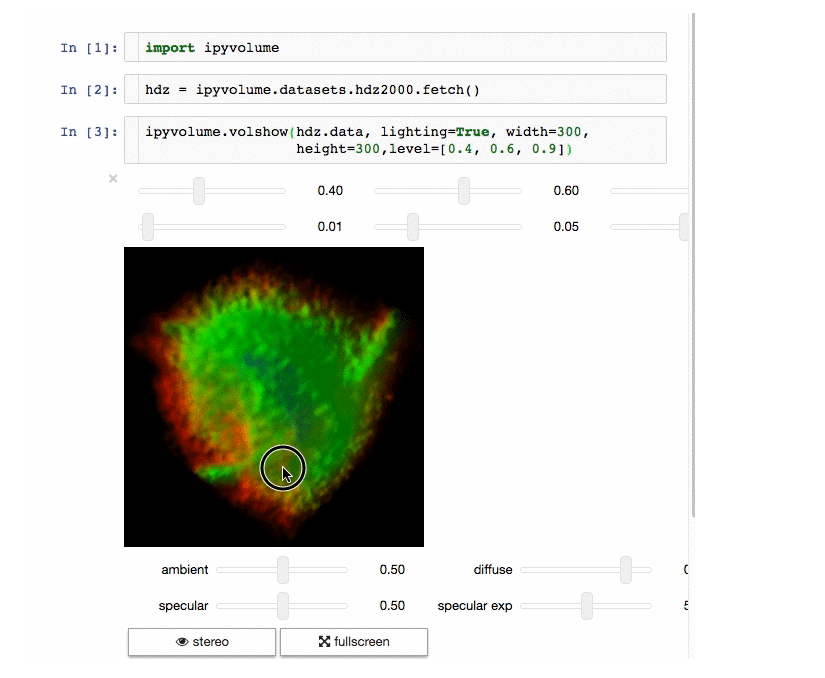
Ipyvolume is an innovative application designed for 3D plotting in Python, specifically within the Jupyter notebook environment. Using WebGL and IPython widgets, it provides a robust platform for visualizing complex data in three dimensions. Its capabilities include volume rendering, scatter plots, quiver plots, isosurface rendering, and lasso mouse selections.
These features make it an incredibly useful tool for data scientists, researchers, and anyone working with data that benefits from 3D visualization. Its primary users are likely to be in the scientific and data analysis fields, where visualizing high-dimensional data is essential.
The application can render within the Jupyter notebook or create standalone HTML pages, offering flexibility depending on the user's needs.
Requirements
The app is primary designed for the data scientists, data engineers and data analysis who already have a good experience with Python and the Jupyter notebook environment.
Features
- 3D plotting in Python
- Volume rendering
- Scatter plots creation
- Quiver plots creation
- Isosurface rendering
- Lasso mouse selections
- Rendering in the Jupyter notebook
- Creation of standalone HTML pages
- Stereo rendering for virtual reality with Google Cardboard
- D3 style animations
- Sequences animations
- Stylable interfaces
- Integration with ipywidgets for adding GUI controls
- Integration with bokeh by linking the selection
- Integration with bqplot by linking the selection
License
The app is released as an open-source project under the MIT License.
Resources & Downloads
 widgetti