DataPlane - The Free Right Pipeline Data Manager for Data Engineers

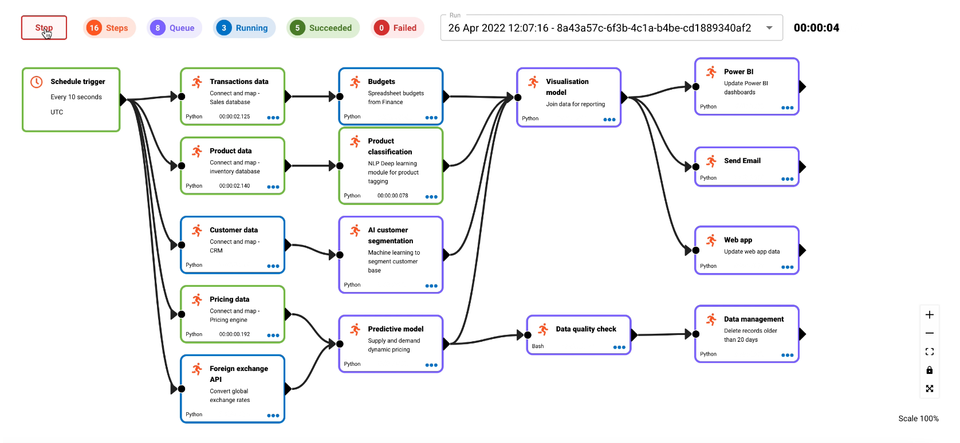
Table of Content
What is DataPlane?
DataPlane is a high-performance software written in Golang, featuring a drag-drop data pipeline builder, built-in Python code editor, granular permissions for team collaboration, secrets management, a scheduler with multiple time zone support, and isolated environments for development, testing, and deployment.
It also allows monitoring of real-time resource usage, distributed computing with worker groups, adding more replicas for high availability and scale, and is cloud-native.
Features
- Simple setup
- Extremely Fast
- Developer friendly
- Comes with a user-friendly drag and drop pipeline manager and editor
- Schedule with multiple timeline zone support
- Minimal low memory and CPU footprint
- Comes with a built-in Python code editor
- Better queue management
- Granular permissions for teams to collaborate with segregated access
- ⭐️ Distributed computing with worker groups.
- Secrets management with logging redaction allows team members to use secure resources without revealing passwords.
- Easy to install and configure using Google.
Tech Stack
The app is a cloud based app that is written using Goland and React for a frontend.
Install
To install the app you are required to have Docker and Docker Compose installed at your system. When ready, you can download the Docker-compose.yml file and run it using the following command:
curl -LfO 'https://raw.githubusercontent.com/dataplane-app/dataplane/main/quick-start/docker-compose.yaml'

docker-compose up
License
The project published in this git repo is released under the Source Available License - Business Source License 1.1 (BSL). The license was chosen to discourage cloud providers offering this project as a data platform service.
Resources & Downloads
 dataplane-app