Apache Superset - The Must Know and Have Tools for Data Scientists and Data Engineers

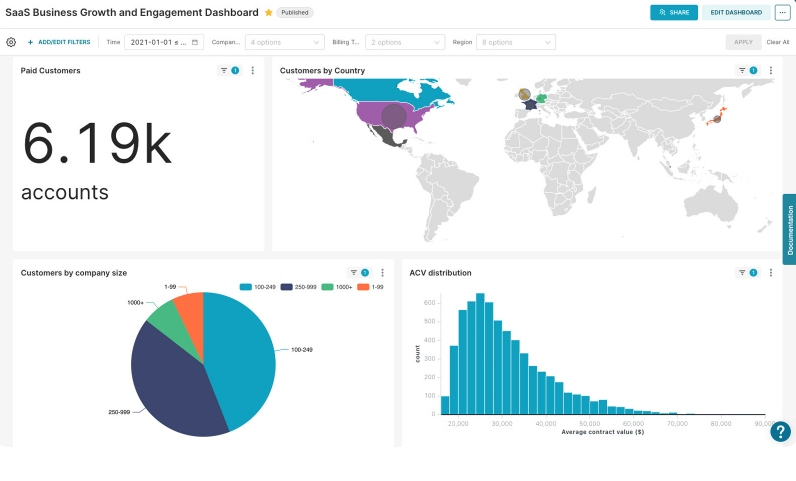
Table of Content
Apache Superset stands as a premier open-source data exploration and visualization platform, ingeniously designed to facilitate the creation of dynamic, insightful dashboards. It is a must-have tool for data scientists, data engineers, teams and business intelligence experts.
Built for Data Exploration
It effortlessly empowers users to navigate data from diverse sources via an intuitive interface, eliminating the need for extensive programming knowledge. You can confidently run SQL queries, visualize data, and delve into datasets at your convenience.
Seamless Data Visualization
Superset proudly offers a vast array of visualization types, from bar charts and line charts to pie charts, heat maps, and beyond.
These visualizations are not merely static displays; they are interactive, inviting users to drill down into data and unearth valuable insights.
Create Data-focused Dashboards
Creating and customizing dashboards is a breeze with Superset's drag-and-drop functionality. Share your dashboards with others to enable collaboration and spread insights throughout your team or organization.
 Hazem Abbas
 Hazem Abbas
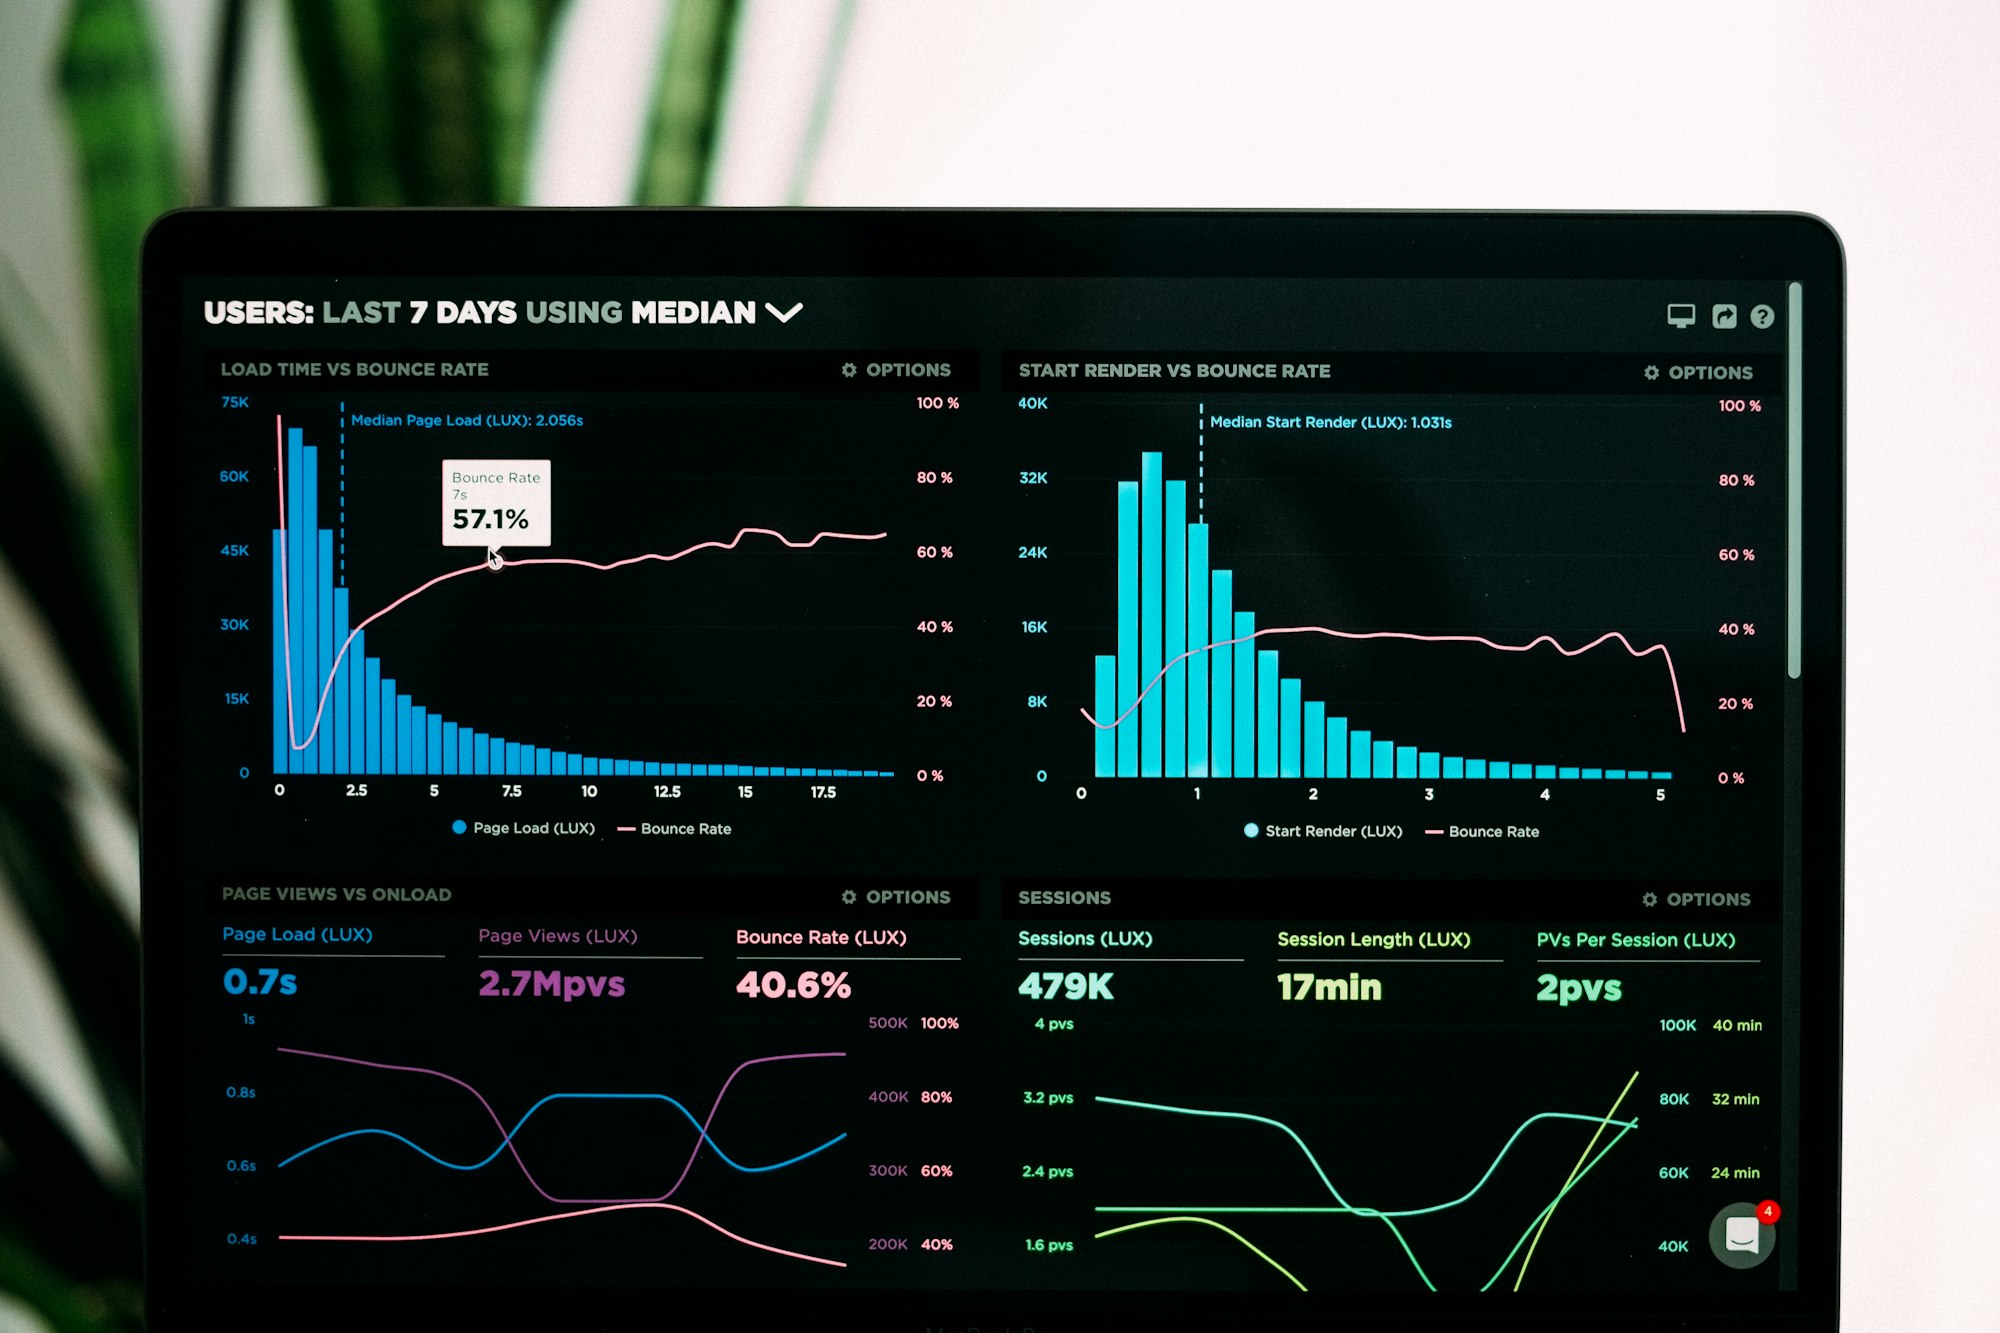
Supports multiple databases, data warehouses
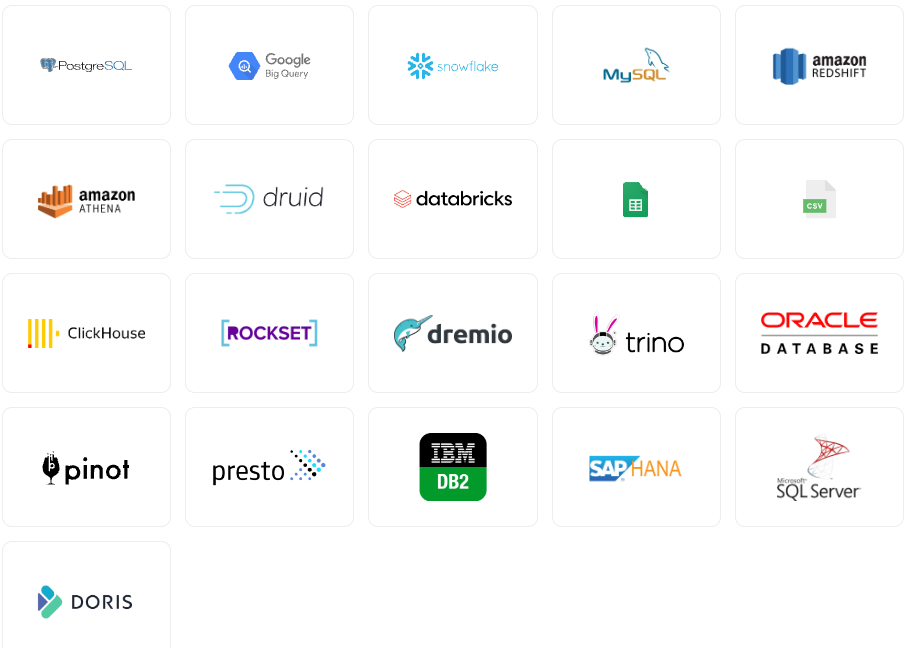
Superset asserts compatibility with a multitude of databases and data warehouses, including but not exclusive to Apache Druid, Apache Hive, Apache Impala, Apache Kylin, Presto, and a host of SQL databases such as MySQL, PostgreSQL, and Oracle.
Built-in SQL editor
The tool incorporates an advanced SQL editor, equipped with features like syntax highlighting, autocomplete, and query history, making it an invaluable asset for advanced users crafting complex SQL queries.
Hazem Abbas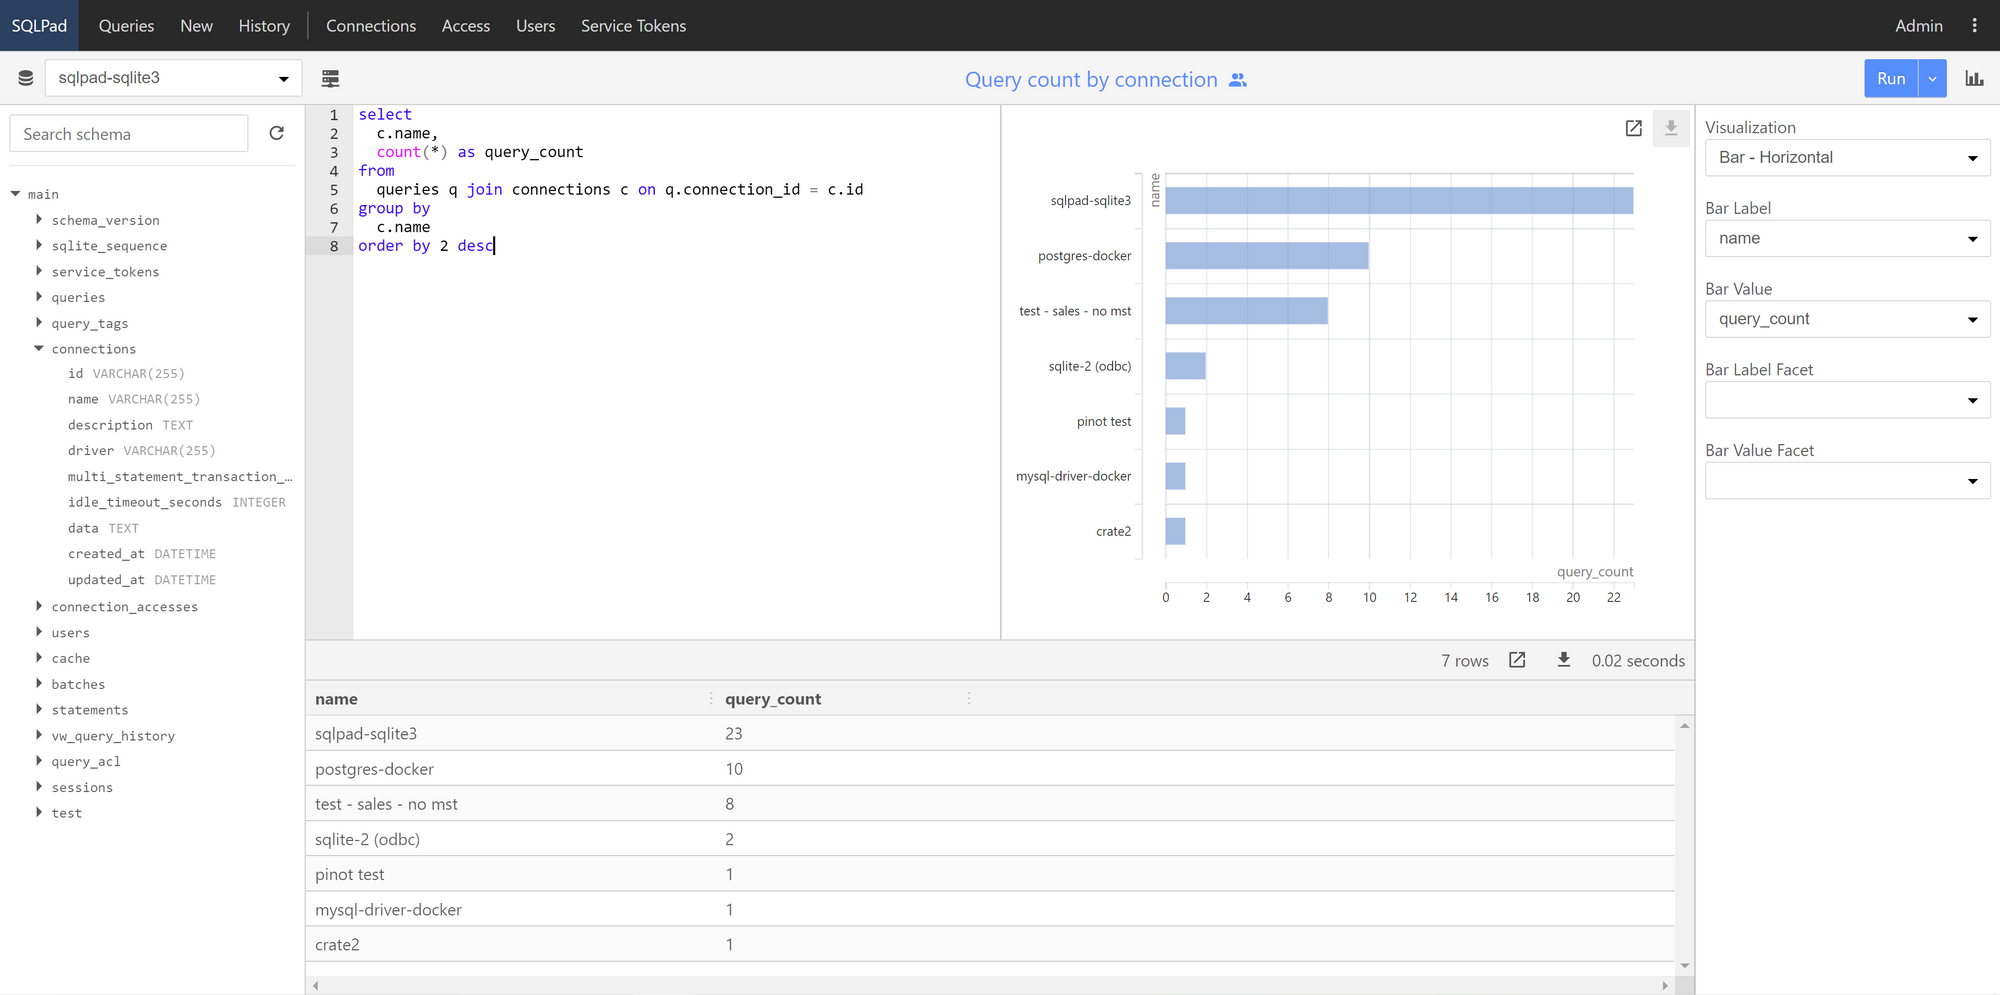
Security is not an option
Security is no afterthought in Superset. It boasts robust features, including role-based access control (RBAC) and seamless integration with authentication providers like OAuth, LDAP, and database security.
Key Features
- Fast and efficient loading of charts and dashboards due to the powerful data caching feature which saves time and improves user experience.
- A vast array of over 40 pre-installed visualizations, providing a range of options to represent data in a visually appealing and insightful manner.
- The ability to perform ad-hoc data exploration using virtual datasets, allowing users to explore and analyze data on the fly without affecting the original data source.
- Advanced data analysis capabilities with features such as drill-to-detail, cross-filters, and drill-by, which provide a detailed and in-depth understanding of the data.
- Support for SQL data transformations using a semantic layer, facilitating complex data transformations and manipulations using SQL.
- Creation of interactive dashboards using Jinja templating and dashboard filters, which enables users to create dynamic and responsive dashboards.
- Customization of charts and dashboards using CSS templates, allowing users to modify the look and feel of the visualizations to align with their brand's aesthetics.
- Comprehensive support for SQL queries and drag-and-drop functionality, making data exploration and visualization a seamless and intuitive process.
- Access to the latest features and functionalities through feature flags, ensuring users are always up-to-date with the latest enhancements and updates.
Use-cases
- Data Exploration:
- Analysts and data scientists use Superset to explore datasets interactively, running SQL queries, filtering data, and visualizing results to understand underlying trends and patterns.
- It provides tools to quickly slice and dice data, making it easier to perform ad-hoc analysis and discover insights.
- Business Intelligence (BI):
- Superset is a powerful BI tool that allows organizations to create comprehensive and interactive dashboards.
- It helps businesses track key performance indicators (KPIs), monitor metrics, and generate reports to inform decision-making processes.
- Data Visualization:
- Superset offers a variety of visualization types, enabling users to represent data in a visually appealing and comprehensible manner.
- Visualizations such as line charts, bar charts, pie charts, heat maps, and geographical maps help in conveying information effectively.
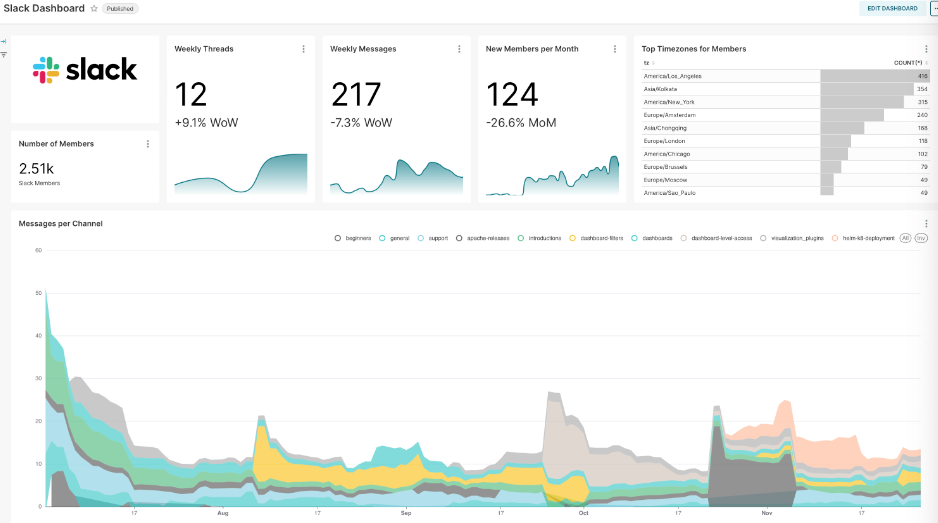
- Dashboard Creation:
- Users can build and customize dashboards by combining multiple visualizations and arranging them into a cohesive layout.
- Dashboards can be shared with teams and stakeholders, providing a centralized view of important data metrics.
- Reporting:
- Superset can be used to generate periodic reports, automate data refreshes, and schedule report distribution to various recipients.
- It supports exporting dashboards and visualizations in various formats (e.g., PDF, CSV).
- Monitoring and Alerting:
- Superset can be integrated with data sources that provide real-time data, allowing for monitoring of live data streams.
- Users can set up alerts based on specific conditions or thresholds, receiving notifications when certain criteria are met.
- Collaboration:
- Superset enables teams to collaborate on data analysis and dashboard creation.
- It supports annotations and comments, facilitating communication and sharing of insights among team members.
- Custom Application Development:
- Developers can extend Superset’s functionality by adding custom visualizations, integrating with other tools, and developing plugins to meet specific business requirements.
Hazem AbbasFinal Thought
Apache Superset's high extensibility allows developers the freedom to add custom visualizations, plugins, and functionalities to meet unique needs. As an Apache project, Superset thrives on the support and contributions of a vibrant, active open-source community, ensuring its continuous evolution, updates, and support.
Overall, Apache Superset is a versatile tool used across various industries, including finance, healthcare, retail, and technology, for tasks such as data analysis, business intelligence, and decision support.
Resources
Hazem Abbas